Charts & Infographics@Gdgtify
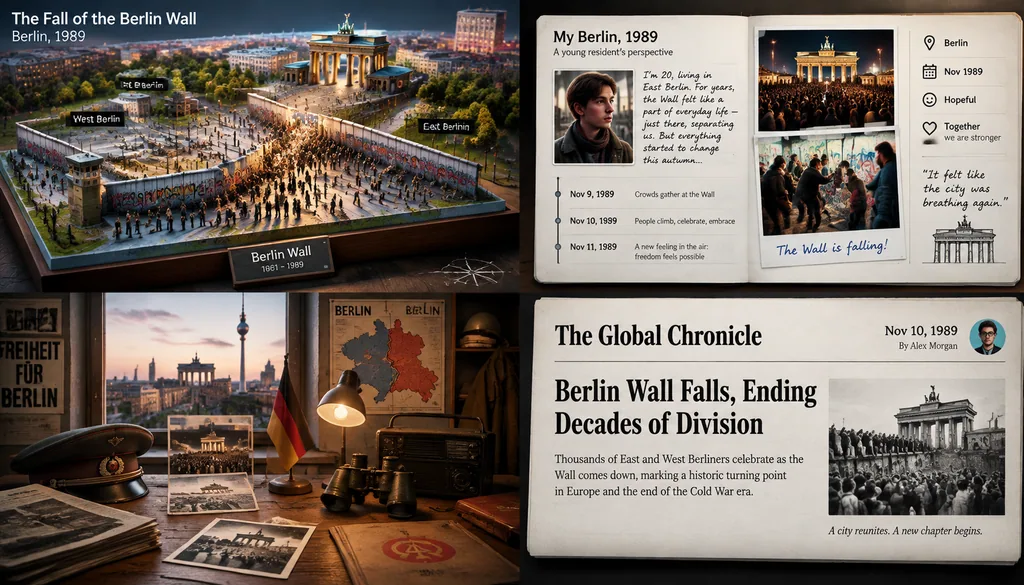
Historical Event Diorama Map Grid
2x2 grid, 16:9, do this for 4 famous historical events: Render_Target = (…
- UI
- Infographic
- Classical
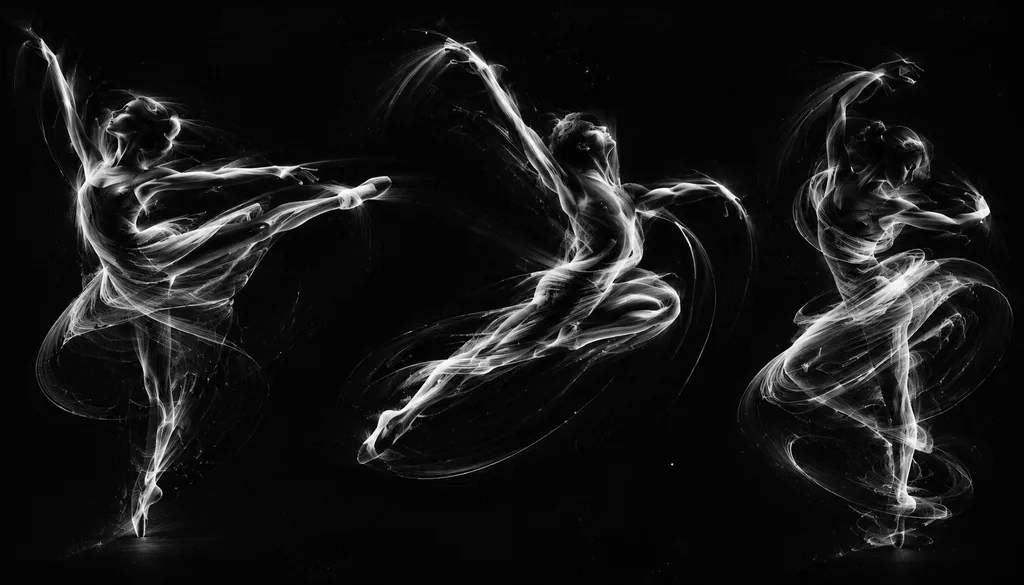
Copy this GPT-Image-2.5 prompt, replace each word in [BRACKETS] with your own detail, then press Use this prompt to make the picture in Image Studio.
<instructions>
input = 3 legendary dancer/choreographer
input = ai inferred signature movement sequence

function render_kinesphere ($ dancer, $ movement)
  anchor:
    [figure composed entirely of motion trails] :: [the $ movement sequence traced as continuous luminous bands that coalesce into a portrait of $ dancer]::5

  morphology:
    the arabesque trails weave the skull, a grand jeté arc forms the cheekbone, the arms' sweep creates the jaw, stillness is implied by negative spaces::4

  material physics:
    blackened silver gelatin print, faint chemical residue, slight motion blur, glowing filament traces like a Marey wheel photograph::3

  illumination:
    complete darkness with bioluminescent-like light trails, no external light sources, high contrast::2

  render stack:
    chronophotography, fine art dance study, 8k, kinetic sculpture concept::1

  negative:
    [still body parts, studio lights, solid silhouettes]::-1
</instructions>
Example values used for this picture: [figure composed entirely of motion trails] = figure composed entirely of motion trails; [the $ movement sequence traced as continuous luminous bands that coalesce into a portrait of $ dancer] = the $ movement sequence traced as continuous luminous bands that coalesce into a portrait of $ dancer; [still body parts, studio lights, solid silhouettes] = still body parts, studio lights, solid silhouettes.
Inspired by @Gdgtify
Charts & Infographics@Gdgtify
2x2 grid, 16:9, do this for 4 famous historical events: Render_Target = (…
Charts & Infographics@j_smeaton99
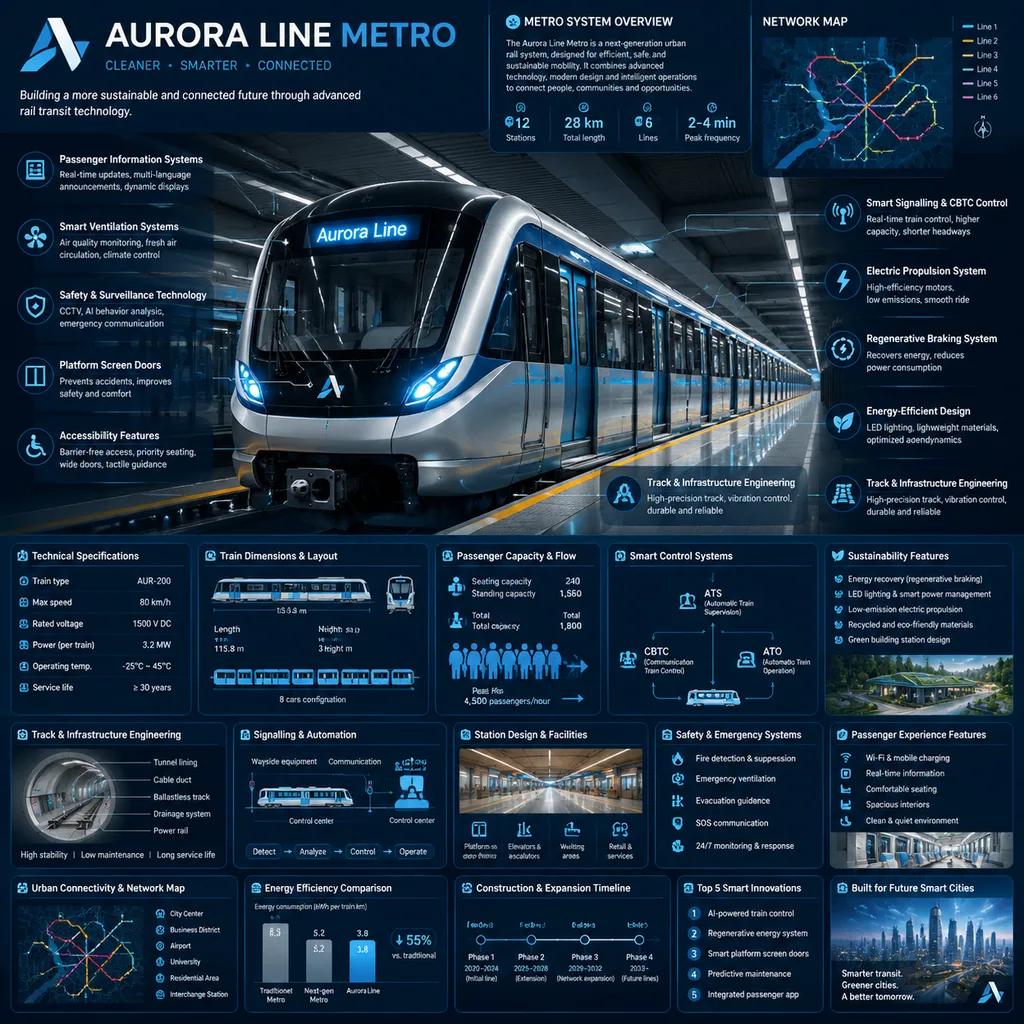
Create a premium square “reference-style urban transportation infographic” centered around a futuristic modern metro…