Charts & Infographics@ToroJushiAi
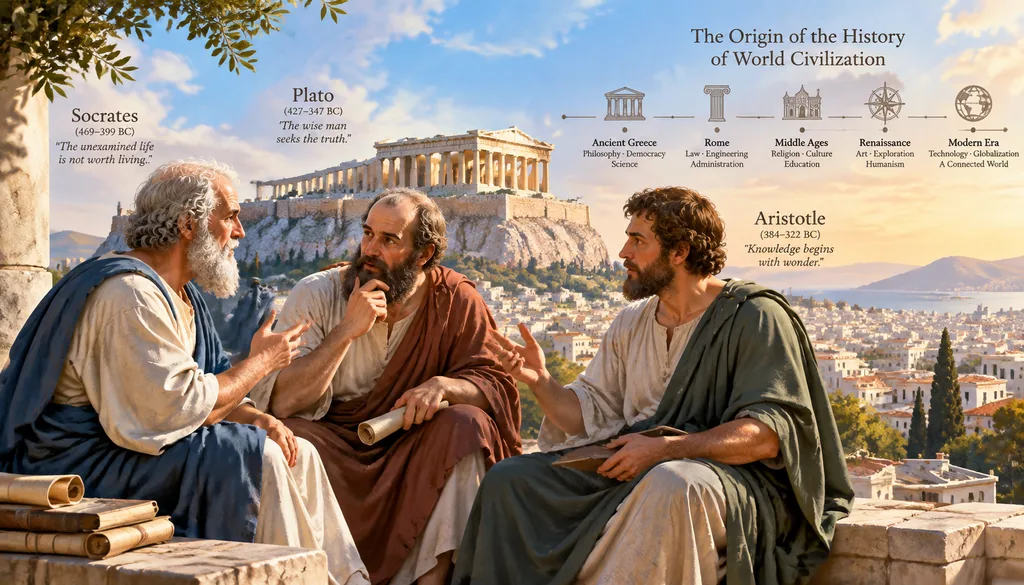
Ancient Greek Philosophers Timeline Map
Two thousand five hundred years ago, Plato, Socrates, and Aristotle sat chatting on the streets of Athens, and their…
- Charts

Copy this GPT-Image-2.5 prompt, replace each word in [BRACKETS] with your own detail, then press Use this prompt to make the picture in Image Studio.
instructions> [SUBJECT]=Coronavirus. A hyper-realistic 3D zoom-sequence infographic generated from a single input: [SUBJECT]. The system auto-detects scale layers from atomic/subcomponent to full contextual view. Layout Structure (CRITICAL) 6–8 circular or hexagonal frames arranged in expanding sequence Innermost frame = smallest detectable detail; outermost = full subject in environment Frames connected by subtle zoom-path lines No repeated scales — each frame shows new level of detail Frame Design Each zoom level includes: Hyper-detailed 3D render at that scale Micro label: scale name (e.g., "molecular," "cellular," "structural") + 3–5 word insight Optional: measurement tag or magnification factor Contextual Halo Around the sequence, include only scale-specific references: Measurement units, scientific notation, cultural scale metaphors (No generic magnifying glass icons) Scale Panel (Alternative Layout) Zoom level Key insight (3–5 words) Scale factor tag Detail icon (grid, wave, particle, etc.) Title "[SUBJECT]: AT EVERY SCALE" (or) "ZOOM: THE WORLD OF [SUBJECT]" Style: ultra-realistic 3D render, scientific editorial infographic, precise macro lighting, global illumination, shallow depth of field, clean sequential layout. </instructions>Example values used for this picture: [SUBJECT] = Coronavirus.
Inspired by @Gdgtify
Charts & Infographics@ToroJushiAi
Two thousand five hundred years ago, Plato, Socrates, and Aristotle sat chatting on the streets of Athens, and their…
Charts & Infographics@meng_dagg695
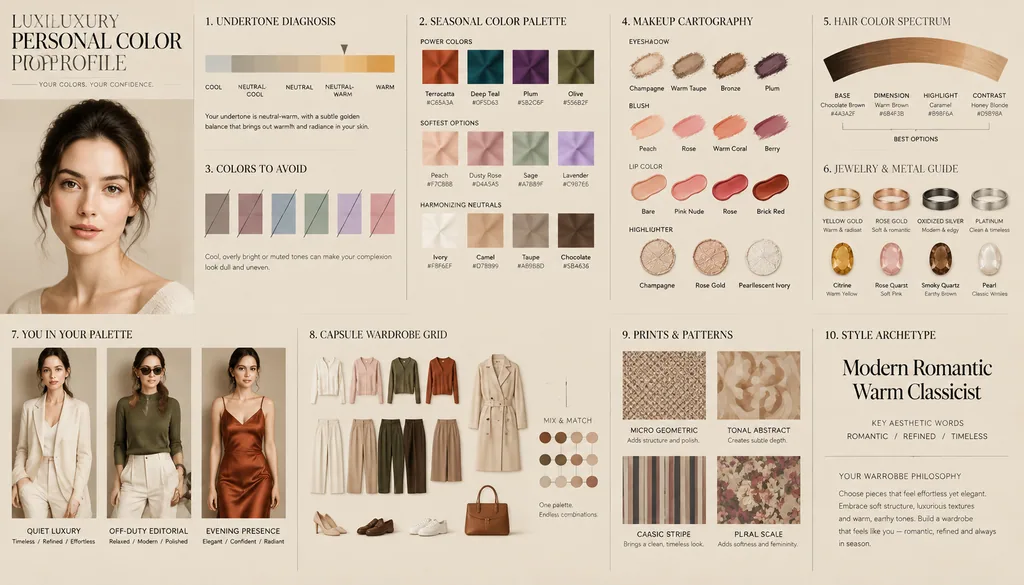
LUXURY PERSONAL COLOR PROFILE — EDITORIAL LAYOUT Studio portrait of subject as anchor — skin retouched to luminous…